Give Your E-Learning Quiz Results Slides a Makeover #363
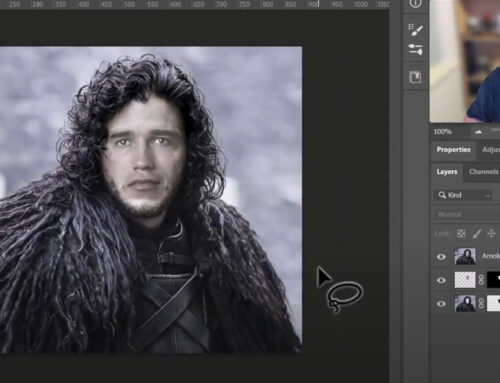
Another challenge from E-Learning Heroes which is about redesigning the results slide from Storyline 360 (which some of you may know is pretty basic out of the box)
Strangely enough, there is no way to present results via an infographic in Storyline so I ended up using Photoshop to make a pie-chart with 5 states. I had to match this to the number of questions in the quiz so that they matched up. Otherwise, there would have to be 100 different states. Nicole Legault has a fantastic looking Pie Chart demo, however, it cannot be controlled via the score variable (sadly).